Manufacturing P&L Statement Guide (+ Templates)
Master Your Margins: How to Create a Manufacturing P&L Statement (With Templates) If you run a manufacturing business, you already know that building a physical product is only half the battle. The other half is understanding exactly how much it costs to produce that product and whether your pricing leaves room for growth. This is…
Master Your Margins: How to Create a Manufacturing P&L Statement (With Templates)
If you run a manufacturing business, you already know that building a physical product is only half the battle. The other half is understanding exactly how much it costs to produce that product and whether your pricing leaves room for growth. This is where your financial reporting becomes your most valuable operational tool.
A manufacturing P&L (Profit and Loss) statement is a critical financial document that summarizes the revenues, costs, and expenses a business incurs during a specific period. It is often referred to as an income statement by accountants and financial professionals.
Unlike standard service or retail business statements, a manufacturing P&L statement requires a highly detailed breakdown of your Cost of Goods Sold (COGS). It must incorporate direct materials, direct labor, and manufacturing overhead to accurately reflect your financial health. By mastering this document, you gain unparalleled insight into your production efficiency and the overall profitability of your manufacturing operation.
What You Need to Prepare
Before assembling your financial data, you must gather specific records and tools to ensure total accuracy. Trying to build a P&L from memory or scattered desk receipts will only lead to costly miscalculations.
Setting up a systematic approach saves you time and prevents financial blind spots. Here are the core components you need to collect before calculating your margins.
Accounting Software or Spreadsheet Tools
First, choose a reliable platform to organize your line items logically. High-quality financial software acts as the foundation of your reporting.
Cloud-based platforms like QuickBooks or Xero are industry favorites because they automate many categorization tasks. Alternatively, you can use a dedicated Excel or Google Sheets template if you prefer a more hands-on, customizable approach.
The key is consistency. Whichever tool you choose must allow you to easily track historical data and compare period-over-period performance.
Comprehensive Sales and Revenue Data
Next, gather all data regarding your gross sales for the accounting period. Gross sales represent the total unadjusted revenue generated from all goods sold before any deductions.
However, gross sales alone will not give you an accurate picture of your incoming cash. You must also track down any records of returns, allowances, and early payment discounts given to customers.
Having these precise deduction figures ensures you do not accidentally overstate your actual revenue.
Detailed Inventory Records
Inventory is the lifeblood of any manufacturing business, and tracking it meticulously is non-negotiable. You will need precise beginning and ending inventory counts for the financial period.
To build an accurate statement, you must separate this data into three distinct categories:
- Raw Materials: The unprocessed goods and components waiting to be used in production.
- Work-in-Progress (WIP): Partially completed products that are still on the factory floor.
- Finished Goods: Fully completed products that are ready to be shipped and sold to customers.
Operational and Administrative Expense Receipts
Finally, collect all records of non-manufacturing expenses. These are the costs associated with running the broader business, rather than the factory itself.
Be sure to locate receipts and payroll data for sales commissions, executive salaries, and marketing costs. You must also include general administrative costs like office utilities, software subscriptions, and legal fees.
Keeping these expenses strictly separated from your factory floor costs is vital for accurate reporting.
Step-by-Step Guide: Building Your Manufacturing P&L Statement
Follow this logical progression to transform your raw data into a clear financial narrative. Taking this step-by-step approach ensures you do not miss critical deductions or misallocate your costs.
Step 1: Calculate Net Sales Revenue
Begin by tallying your total gross sales for the period. This represents every dollar that came through the door from product sales.
Next, subtract any sales returns, product allowances, and customer discounts from that gross total. The resulting figure is your Net Sales Revenue.
Net Sales Revenue is your total adjusted sales income, serving as the top line of your P&L statement. Every subsequent expense will be subtracted from this critical number.
Step 2: Determine Cost of Goods Sold (COGS)
This is the most critical and complex step for manufacturers. Cost of Goods Sold (COGS) is the direct, total cost of producing the specific goods your business successfully sold during the period.
To calculate your COGS accurately, you must add together three distinct manufacturing costs:
- Direct Materials: The cost of the raw materials directly used and consumed in the production of your finished goods.
- Direct Labor: The wages, payroll taxes, and benefits of the employees directly assembling or manufacturing the products.
- Manufacturing Overhead: Indirect costs tied strictly to the factory floor, such as factory rent, equipment utilities, and indirect labor (like floor supervisors or maintenance crews).
Step 3: Compute Your Gross Profit
Once you have your total COGS, you can determine how efficiently your factory is operating. Subtract your total COGS (calculated in Step 2) from your Net Sales Revenue (calculated in Step 1).
The resulting figure is your Gross Profit. Gross Profit represents the revenue remaining after deducting the direct costs of production, highlighting the pure efficiency of your core manufacturing process.
A healthy gross profit means your production costs are well-managed relative to your pricing strategy. If this number is shrinking, you either need to raise prices or cut factory floor costs.
Step 4: Deduct Operating Expenses (SG&A)
Now it is time to account for the corporate side of your business. List and subtract all Selling, General, and Administrative (SG&A) expenses from your Gross Profit.
Operating expenses (SG&A) are the daily costs of running your business that are not tied directly to the factory floor. This includes marketing campaigns, corporate legal fees, executive payroll, and office rent.
Subtracting these operating expenses from your Gross Profit gives you your Operating Income. This shows how profitable your core business model is before dealing with banks and the government.
Step 5: Calculate EBITDA and Net Income
The final step involves managing your financial and tax obligations. First, calculate your Earnings Before Interest, Taxes, Depreciation, and Amortization (EBITDA).
From your EBITDA, carefully subtract your bank interest, tax liabilities, factory equipment depreciation, and amortization. Equipment depreciation is an accounting method that spreads out the cost of a physical asset over its usable lifespan.
After making these final deductions, you arrive at your Net Income. Net Income is your true bottom line, representing total profit after absolutely all expenses are subtracted.
Common Mistakes to Avoid
When generating financial reports, small errors can lead to vastly inaccurate profit margins. Manufacturers face unique accounting challenges that retail and service businesses simply do not encounter.
Here are the most common pitfalls to watch out for as you build your statement.
Misclassifying Manufacturing Overhead as Operating Expenses
It is incredibly easy to lump all of your company's utility bills or rent payments into one general category. However, putting factory rent or machine maintenance into the SG&A category instead of COGS is a critical error.
Doing so will artificially inflate your Gross Profit margin. This gives investors and leadership a dangerously false impression of your actual production efficiency. Always draw a hard line between factory-related overhead and corporate office overhead.
Inaccurate Inventory Valuation
Your COGS calculation relies entirely on the accuracy of your inventory counts. Failing to accurately count or price your inventory at the end of the period directly corrupts the COGS formula.
If you underestimate the value of your ending inventory, your COGS will look artificially high, shrinking your perceived profit. Regular cycle counts and rigorous tracking of raw materials, WIP, and finished goods are mandatory to prevent this.
Failing to Account for Equipment Depreciation
Manufacturing requires heavy machinery, and that machinery loses value over time. Neglecting to factor in the wear-and-tear (depreciation) of these expensive assets is a common rookie mistake.
Ignoring depreciation results in an overstated net income, making you look more profitable than you actually are. More importantly, it can lead to unexpected tax liabilities and a lack of reserved capital when machines eventually need replacing.
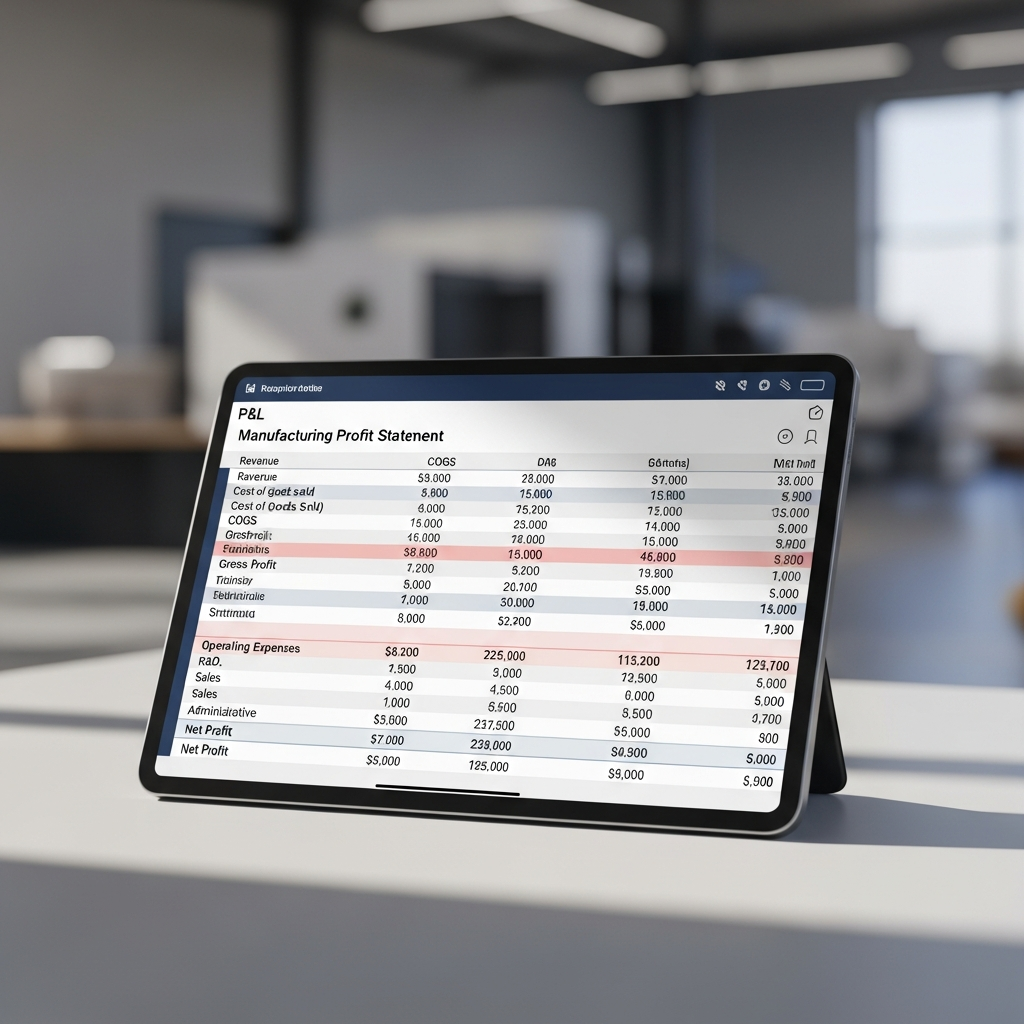
The Final Result: Manufacturing P&L Statement Template and Examples
Once you have completed the steps above, your final result should look like a structured, easy-to-read financial summary. A well-organized P&L statement tells the story of your business clearly, from top-line revenue to bottom-line profit.
The Standard Manufacturing P&L Template Layout
Your final template should always follow this logical, top-to-bottom flow:
- Net Sales (Top Line Revenue)
- Less: Cost of Goods Sold (Itemized by Direct Materials, Direct Labor, and Manufacturing Overhead)
- Gross Profit (Net Sales minus COGS)
- Less: Operating Expenses (Itemized by Selling, General, and Admin costs)
- Operating Income (Gross Profit minus Operating Expenses)
- Less: Interest, Taxes, Depreciation, and Amortization
- Net Income (The Bottom Line)
Real-World Example: Custom Parts Manufacturer
Let's review a sample statement for a fictional custom parts manufacturer to see this flow in action. Imagine this company generated $1,050,000 in gross sales but had $50,000 in customer returns, leaving a Net Sales Revenue of $1,000,000.
Their production costs included $300,000 in materials, $200,000 in direct labor, and $100,000 in factory overhead. This brings their total COGS to $600,000. Subtracting that from their net sales leaves a Gross Profit of $400,000.
Next, they deduct $200,000 in corporate operating expenses (SG&A), resulting in an Operating Income of $200,000. Finally, they subtract $50,000 to cover loan interest, taxes, and machine depreciation. This translates into a final Net Income of $150,000.
Frequently Asked Questions
What is the difference between a manufacturing P&L statement and a standard retail P&L?
The primary difference lies in how Cost of Goods Sold (COGS) is calculated. A retail P&L simply calculates COGS based on the wholesale price of the finished goods they purchased for resale.
A manufacturing P&L statement, however, must calculate COGS by breaking down the cost of raw materials, factory labor, and manufacturing overhead. Retailers buy finished products; manufacturers must account for the actual creation of the goods from scratch.
How often should I generate a P&L statement for my manufacturing business?
While an annual P&L is strictly required for tax purposes, checking your margins once a year is a recipe for disaster. Manufacturers should generate a P&L statement monthly, or at the very least, quarterly.
Reviewing this data monthly allows leadership to spot supply chain cost increases, inefficiencies in factory labor, or creeping overhead expenses immediately. Catching these issues early lets you pivot before they severely impact the bottom line.
How does Work-in-Progress (WIP) inventory affect the P&L?
Work-in-Progress (WIP) represents partially finished goods that are still on the factory floor at the end of an accounting period. Because they are not yet finished, sellable goods, they are treated differently in your accounting.
Their associated material and labor costs are held in the inventory asset account on your balance sheet. They are not yet recognized as COGS on the P&L statement until the product is fully completed and successfully sold.