Key Metrics for Your Manufacturing Financial Dashboard
10 Key Metrics That Matter for Your Manufacturing Financial Dashboard In manufacturing, survival requires more than just keeping the production lines moving. It demands a deep, continuous understanding of how every operational movement impacts your bottom line. A manufacturing financial dashboard is a visual tracking tool that consolidates complex financial and operational data into real-time,…
10 Key Metrics That Matter for Your Manufacturing Financial Dashboard
In manufacturing, survival requires more than just keeping the production lines moving. It demands a deep, continuous understanding of how every operational movement impacts your bottom line.
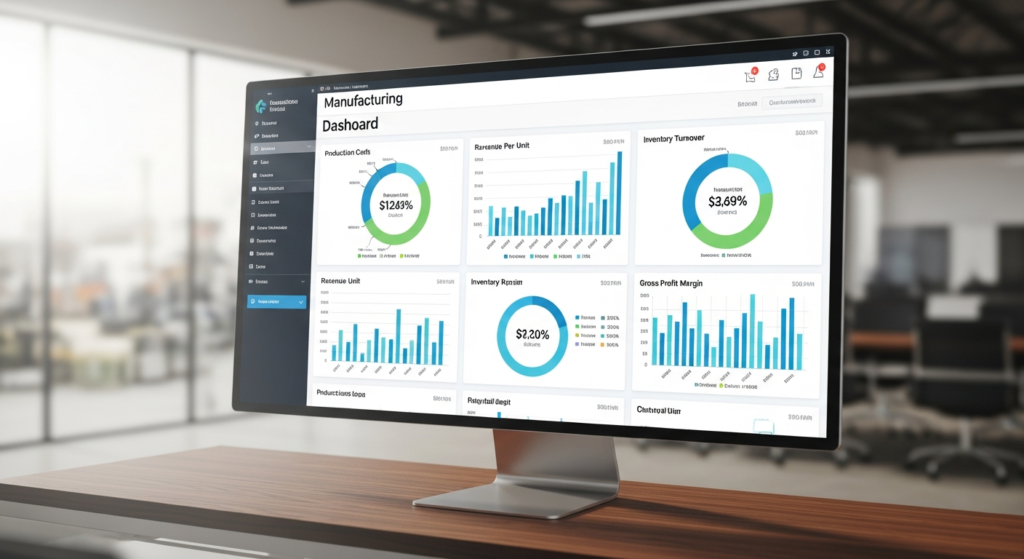
A manufacturing financial dashboard is a visual tracking tool that consolidates complex financial and operational data into real-time, digestible insights for manufacturing businesses. Think of it as the central nervous system of your plant’s financial health.
Historically, there has been a massive disconnect between the factory floor and the finance department. Plant managers focus on output, machine uptime, and cycle times, while financial controllers focus on margins, cash flow, and cost variances.
This creates siloed data, leading to delayed reporting, unnoticed inefficiencies, and ultimately, severe margin erosion. When finance and operations speak different languages, profits slip through the cracks.
The solution lies in tracking the right Key Performance Indicators (KPIs) in a centralized location. A well-built financial dashboard bridges the operational gap, allowing CFOs and plant managers to speak the same language. By tracking these key metrics, leadership teams can proactively drive profitability, control costs, and scale operations efficiently.
The Strategic Value of a Manufacturing Financial Dashboard
A dashboard is more than just a collection of charts and graphs. It is a strategic tool that fundamentally changes how a manufacturing business operates.
Bridging the Gap Between Operations and Finance
In many plants, a physical breakdown on the floor takes weeks to appear in the financial reports. A dashboard connects physical production realities directly to financial outcomes.
When a machine goes down for three hours, operations sees lost time, but finance needs to see the exact dollar amount of lost revenue and absorbed overhead. By integrating these viewpoints, leaders can make immediate decisions based on financial reality, rather than operational guesswork.
This alignment ensures that every operational improvement is tied to a financial goal. It stops teams from pursuing efficiency for efficiency’s sake and focuses them on actions that actually generate profit.
Shifting from Reactive to Proactive Decision Making
Relying on end-of-month financial close reports is like driving a car while looking only in the rearview mirror. By the time you see the problem, the damage is already done.
Real-time data allows manufacturers to shift from a reactive posture to a proactive strategy. If material costs spike mid-month, a live dashboard alerts the team immediately, allowing for rapid pricing adjustments or supplier negotiations.
This agility is a massive competitive advantage. It empowers teams to course-correct in the middle of a production run, saving thousands of dollars before the month even ends.
Enhancing Stakeholder Alignment
Misaligned teams often waste hours debating whose data is correct. A unified dashboard creates a single source of truth for executives, investors, and plant managers alike.
When everyone looks at the same numbers, meetings transform from data-debates into strategy sessions. Investors can clearly see liquidity trends, executives can monitor high-level margins, and plant managers can track daily cost variances.
This transparency builds trust across the organization. It ensures that from the boardroom to the breakroom, the entire company is pulling in the exact same financial direction.
Profitability and Cost Management Metrics
To run a profitable plant, you must understand exactly where your money is coming from and where it is leaking out. These four metrics are the bedrock of manufacturing profitability.
1. Gross Profit Margin by Product Line
Atomic Definition: Gross profit margin by product line measures the profitability of individual products by subtracting their specific direct production costs from their specific revenue.
Looking at your overall, company-wide gross margin is simply not enough. A blended margin often hides dangerous truths, such as a highly profitable flagship product subsidizing a failing, low-margin secondary item.
Manufacturers must identify exactly which products are driving the bulk of their profit and which ones act as loss leaders.
By tracking this metric dynamically on your dashboard, you can make smarter strategic choices. You might decide to:
- Increase marketing spend for high-margin products.
- Raise prices on low-margin products to justify their production.
- Discontinue certain product lines entirely to free up valuable floor space.
2. Manufacturing Cost Per Unit
Atomic Definition: Manufacturing cost per unit is the total cost of production (materials, labor, and overhead) divided by the total number of units produced in a given period.
This is arguably the most critical metric for pricing strategies. If your cost per unit fluctuates and you are unaware, your profit margins will shrink overnight.
Tracking this metric helps you understand the impact of production volume on your fixed costs. As you produce more units, your fixed overhead is spread thinner, ideally lowering the cost per unit.
Keep an eye out for these variables that cause cost per unit to spike:
- Sudden increases in raw material shipping costs.
- Excessive overtime paid to direct labor.
- Machine breakdowns that reduce total output but keep overhead steady.
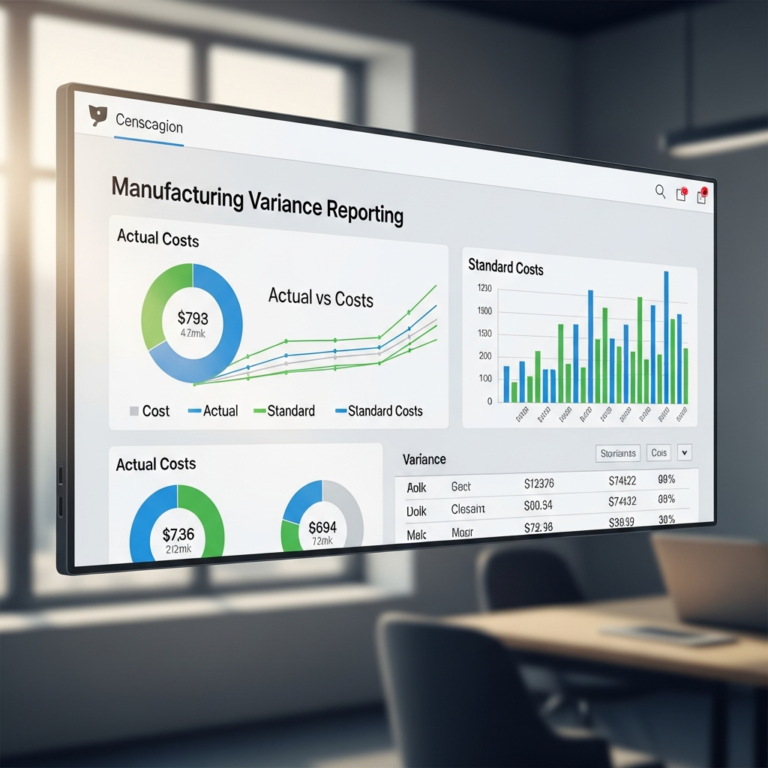
3. Cost of Goods Sold (COGS) Variance
Atomic Definition: COGS variance is the calculated difference between the standard, expected costs of production and the actual costs incurred during the manufacturing process.
When you plan a production run, you do so based on standard costs. However, reality rarely matches the plan perfectly. Materials spoil, labor takes longer than expected, and utility prices fluctuate.
Tracking COGS variance on your dashboard immediately highlights these discrepancies. If the variance is consistently negative (actual costs are higher than standard costs), it is a glaring red flag.
Investigating this variance allows managers to pinpoint exact failures. Whether the purchasing team overpaid for steel or the floor team wasted too much plastic, COGS variance tells you exactly where to look.
4. Operating Profit Margin
Atomic Definition: Operating profit margin is the percentage of revenue remaining after deducting all operating expenses, including COGS and SG&A (Selling, General, and Administrative) costs.
While gross margin tells you how efficiently you manufacture a product, operating profit margin tells you how efficiently you run the entire business. It is the ultimate indicator of operational health.
This metric accounts for the front office, the sales team, the marketing budget, and facility rent. A strong gross margin can easily be wiped out by bloated administrative costs.
Monitoring operating profit margin ensures that your corporate overhead is not eating the profits generated on the factory floor. It demands accountability from every single department, not just production.
Operational Efficiency and Yield Metrics
Efficiency metrics track how well your plant converts raw potential into finished, sellable goods. When tied to financial data, these metrics reveal hidden fortunes.
5. Financial Impact of Overall Equipment Effectiveness (OEE)
Atomic Definition: The financial impact of OEE translates equipment availability, performance, and quality into a specific dollar figure representing lost revenue and wasted overhead.
Traditional OEE is an operational score, usually represented as a percentage. While a plant manager knows that an OEE of 75% needs improvement, the CFO needs to know exactly how much that 25% gap is costing the company.
A financial dashboard bridges this by attaching dollar signs to machine downtime. It calculates the hourly rate of overhead and lost profit for every minute a machine sits idle or produces bad parts.
Translating OEE into dollars drastically changes company behavior. It is much easier to justify a $50,000 preventative maintenance budget when the dashboard proves that machine downtime cost the company $200,000 last quarter.
6. Inventory Turnover Ratio
Atomic Definition: Inventory turnover ratio calculates how many times a company’s inventory is sold and replaced over a specific time period.
Inventory is essentially cash sitting on shelves. If it sits there too long, it loses value, takes up expensive warehouse space, and ties up capital that could be used elsewhere.
A high turnover ratio generally indicates strong sales and efficient inventory management. A low ratio points to overstocking, obsolete products, or slowing market demand.
Your dashboard should track this ratio alongside carrying costs. Key factors to monitor include:
- The warehousing costs of storing unsold finished goods.
- The insurance premiums paid to cover on-hand raw materials.
- The risk of material spoilage or technological obsolescence.
7. Scrap and Rework Costs
Atomic Definition: Scrap and rework costs measure the total financial drain caused by defective products, wasted raw materials, and the additional labor required to fix errors.
Mistakes happen in manufacturing, but they must be ruthlessly quantified. A scrapped part doesn’t just cost you the raw material; it costs you the labor used to make it, the machine time it occupied, and the utility costs to power the machine.
Rework can be even more insidious. Having an employee spend two hours fixing a defective batch means they are not producing new, revenue-generating products.
Tracking this metric daily prevents minor quality control issues from turning into major financial losses. It highlights exactly which machines or processes are causing the most defects, allowing for targeted, immediate intervention.
Cash Flow and Liquidity Metrics
Even a highly profitable manufacturing plant can go bankrupt if it runs out of cash. These metrics ensure you have the liquidity needed to keep the lights on and the machines running.
8. Working Capital Ratio
Atomic Definition: The working capital ratio measures a company’s current assets against its current liabilities to determine its ability to fund day-to-day operations and short-term debt.
Manufacturing is incredibly capital intensive. You have to buy raw materials and pay labor well before the final customer pays you for the finished product.
This ratio (calculated by dividing current assets by current liabilities) provides a quick snapshot of financial health. A ratio between 1.5 and 2.0 is generally considered healthy in the manufacturing sector.
If the ratio dips too low, the plant risks being unable to pay suppliers or meet payroll. If it is too high, it might indicate that the company is hoarding cash instead of investing it back into growth or new equipment.
9. Days Sales Outstanding (DSO) & Days Payable Outstanding (DPO)
Atomic Definition: DSO measures the average number of days it takes customers to pay you, while DPO measures the average number of days it takes you to pay your suppliers.
The relationship between DSO and DPO is the heartbeat of your cash flow. If your customers take 60 days to pay you (DSO), but your suppliers demand payment in 30 days (DPO), you have a massive 30-day cash flow gap.
A robust financial dashboard tracks these numbers side-by-side. It allows the finance team to see where cash is getting trapped in the pipeline.
To optimize this balance, manufacturers can take specific actions:
- Offer early-payment discounts to customers to lower DSO.
- Renegotiate payment terms with key suppliers to extend DPO safely.
- Identify consistently late-paying clients and place them on credit holds.
10. Return on Net Assets (RONA)
Atomic Definition: Return on Net Assets (RONA) is a metric that evaluates how effectively a manufacturing plant utilizes its physical assets (machinery, property, and equipment) to generate net income.
Manufacturers invest millions of dollars in heavy machinery and facility infrastructure. RONA tells executives whether those massive investments are actually generating a worthwhile return.
A declining RONA indicates that the company is buying assets that aren’t producing enough profit. This often happens when plants over-automate or buy excessive equipment for a product line that lacks market demand.
By keeping RONA visible on the dashboard, leadership is forced to justify capital expenditures. It ensures that new equipment purchases are driven by measurable financial ROI, rather than just a desire for the newest technology.
Best Practices for Implementing Your Dashboard
Knowing which metrics to track is only half the battle. Implementing the dashboard correctly ensures that the data is adopted, trusted, and used daily by your team.
Integrating with ERP and MRP Systems
A dashboard is only as powerful as the data feeding it. Manual data entry via spreadsheets completely defeats the purpose of a real-time dashboard.
Your dashboard must pull seamless, automated data directly from your Enterprise Resource Planning (ERP) and Material Requirements Planning (MRP) software. This API connection ensures that every time a purchase order is logged or a production run finishes, the dashboard updates automatically.
Without this direct integration, your dashboard will always be outdated. Automated integrations remove human error, eliminate administrative bottlenecks, and guarantee that leaders are looking at the realities of the present, not the past.
Customizing Views by Role
If you show a plant manager a wall of liquidity ratios, they will ignore the dashboard. If you show a CFO nothing but spindle-speeds and cycle times, they will be equally frustrated.
Successful implementation requires customizing the dashboard views based on the user’s role. The data pool is the same, but the lens changes.
The CFO’s view should prioritize cash flow, DSO, working capital, and overall margins. Meanwhile, the Plant Manager’s view should front-load COGS variance, scrap costs, cost per unit, and the financial impact of OEE. Tailoring the view ensures immediate relevance and drives higher user adoption.
Ensuring Data Hygiene and Accuracy
The most beautifully designed dashboard is useless if it is built on faulty data. The “garbage in, garbage out” phenomenon is the number one reason financial reporting initiatives fail.
Data hygiene must become a cultural priority on the factory floor. If direct labor hours aren’t logged correctly, or if scrap materials are thrown away without being scanned into the system, the financial dashboard will tell a lie.
To maintain clean data inputs, manufacturers should:
- Automate machine data collection using IoT sensors wherever possible.
- Train floor staff thoroughly on how their localized data entry impacts company-wide financials.
- Conduct regular data audits to catch and correct anomalies before they skew executive reports.
Frequently Asked Questions
What is the difference between operational KPIs and financial KPIs in manufacturing?
Operational KPIs measure physical performance and efficiency, such as machine cycle time, unit output, and equipment uptime. Financial KPIs measure the monetary impact of those operations, such as manufacturing cost per unit, gross profit margins, and scrap costs. While operational metrics tell you how fast you are moving, financial metrics tell you if you are actually making money doing it.
How often should a manufacturing financial dashboard be updated?
Ideally, the data should flow into the dashboard in real-time or at least daily via automated ERP integrations. This allows for immediate operational pivots. However, strategic management reviews of the dashboard generally occur weekly or monthly. Real-time data is for immediate course correction; aggregated weekly data is for strategic planning.
Can a dashboard help reduce manufacturing overhead costs?
Yes, absolutely. A detailed financial dashboard provides deep visibility into the specific components of overhead, such as utility usage, indirect labor, and facility maintenance. By categorizing and tracking these costs historically, management can easily pinpoint anomalies, identify wasteful spending, and implement targeted cost-reduction strategies without blindly cutting essential budgets.
What software integrates best with a manufacturing financial dashboard?
Leading data visualization tools like Microsoft Power BI or Tableau are the industry standards for building custom dashboards. These tools natively integrate with major manufacturing ERP and MRP systems, including Oracle NetSuite, SAP, Epicor, and Microsoft Dynamics. The best software for your plant depends entirely on what core ERP system currently houses your operational and financial data.