How to Implement Production Software for Manufacturing
Implementation of Production Software: A Financial and Operational Requirement Deploying production software for manufacturing, including Enterprise Resource Planning (ERP), Manufacturing Execution Systems (MES), or Material Requirements Planning (MRP), is primarily a financial control and workflow improvement tool. Transitioning from fragmented spreadsheet environments to centralized digital systems changes cost control, working capital management, and the accuracy…

Implementation of Production Software: A Financial and Operational Requirement
Deploying production software for manufacturing, including Enterprise Resource Planning (ERP), Manufacturing Execution Systems (MES), or Material Requirements Planning (MRP), is primarily a financial control and workflow improvement tool. Transitioning from fragmented spreadsheet environments to centralized digital systems changes cost control, working capital management, and the accuracy of the General Ledger (GL). When configured correctly, the system ties shop-floor transactions to financial postings, improving standard costing accuracy, real-time variance analysis, and helping finance reach a 5-day month-end close.
What You Need Before You Start
Prior to software selection, the baseline physical and financial data must be verified. Software scales bad processes instead of repairing them. If the current process is flawed, the software will only generate inaccurate financial data faster.
A Dedicated Implementation Team
Appoint a cross-functional task force. From a corporate finance perspective, the Financial Controller or Cost Accountant must co-lead with the Plant Manager. IT handles the architecture, but Finance dictates the GL mapping, cost center routing, and inventory valuation parameters, such as FIFO versus Standard Cost.
Mapped and Documented Processes
Documenting current workflows is required to establish accurate overhead absorption bases. Every physical movement of raw materials (RM) to Work-in-Progress (WIP) to Finished Goods (FG) represents a journal entry. Process mapping dictates how machine hours and direct labor correlate to overhead absorption costing matrices within the new software.
Clean and Organized Data
Data hygiene determines whether the system works on day one. Before migration, execute a full wall-to-wall physical stocktake to establish baseline inventory valuations.
- BOM Audits: Validate Bill of Materials (BOM) and multi-level routing. A 2% error in component quantities on a high-volume BOM cascades into large Purchase Price Variances (PPV) and distorted Gross Margin reporting.
- Vendor and Cost Master: Cleanse supplier lead times and standard cost data to ensure MRP purchasing triggers match cash-flow forecasts.
Adequate Hardware and Infrastructure
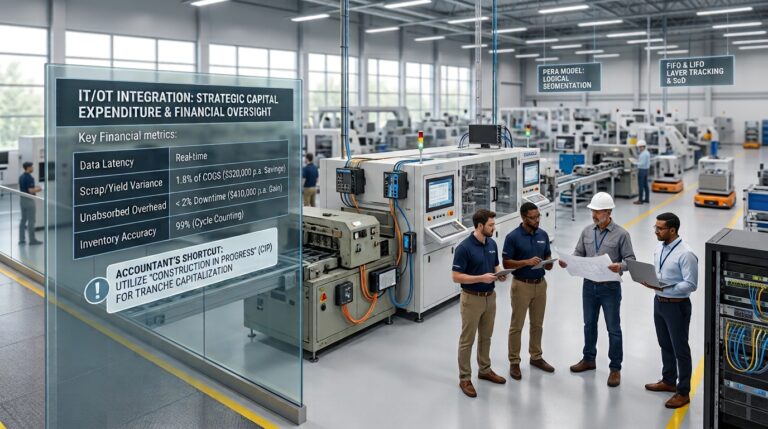
Real-time data collection depends on hardware on the factory floor. Plan capital expenditure (CapEx) for ruggedized barcode scanners, Wi-Fi mesh networking across the factory floor, and workstation terminals at key work centers to allow same-day labor efficiency variance logging and material backflushing.
Step 1: Assessing Needs and Choosing the Right Software
Software selection must address specific discrete, process, or mixed-mode manufacturing bottlenecks. The evaluation matrix must prioritize financial visibility and fit with physical workflows.
Identifying Production Bottlenecks
Analyze historical data to identify excess cash tied up in WIP and inventory. High WIP inventory often masks scheduling conflicts or machine downtime. If labor efficiency variances are consistently unfavorable, the system must provide detailed shift-level time tracking.
Evaluating Software Features
Evaluate software based on its ability to enforce internal controls and automate financial transactions. Core requirements include:
- Perpetual inventory capabilities.
- Automated BOM rollups factoring in current raw material costs, freight-in, and direct labor.
- Scrap and rework tracking linked to distinct GL expense accounts.
- Cycle counting modules that integrate with ABC inventory analysis.
Requesting Demos and Vendor Vetting
Demand structured vendor demonstrations using your actual BOMs and routing data, not generic test environments. Vet the integration architecture between the MES/MRP and the financial suite. Require proof of how the software handles unvouchered payables, three-way matching, and partial work order receipts.
2: Planning the Implementation and Data Migration
Set the implementation schedule around the financial calendar.
Setting a Realistic Timeline
Target the system cutover for the first day of a new financial period, ideally following a low-volume production month and an audited physical stocktake. Break the timeline into discrete phases: Configuration, Master Data Import, User Acceptance Testing (UAT), and Go-Live.
Executing the Data Migration
Migrating opening balances creates a high risk of reconciliation errors. Execute trial migrations and reconcile the trial balance.
Data Migration Validation Matrix:
| Data Category | Legacy System Value | New System Value | Variance Tolerance | Action on Variance |
|---|---|---|---|---|
| Raw Materials | $1,250,400 | $1,250,400 | $0.00 | Full GL reconciliation |
| WIP Valuation | $485,000 | $485,000 | $0.00 | Validate absorbed overhead |
| Open POs | 145 lines | 145 lines | 0 lines | Trace missing POs |
| Standard Costs | $45.50 (Item A) | $45.50 (Item A) | $0.00 | Review BOM rollup logic |
Customizing Workflows and Dashboards
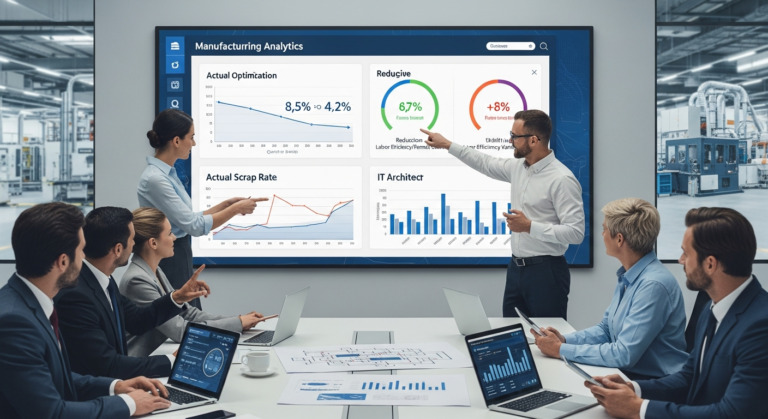
Configure dashboards by user profile: daily PPV, gross margin by product group, and cash forecast for the CFO; OEE (Overall Equipment Effectiveness), scrap rates, and WIP queue times for the Plant Manager. Avoid heavy code customization; use standard reporting tools, such as PowerBI or native SQL reports, to pull data into operational views.
3: Training Your Workforce
Data integrity depends on whether employees use the system correctly. If floor operators bypass barcode scanning, standard costing relies on theoretical backflushing, which can lead to large month-end inventory write-offs.
Training the “Super Users”
Identify department heads to serve as Super Users. In finance, this is the Cost Accountant. In production, it is the Shift Supervisors. They must understand the downstream financial impact of operational data entries, such as how closing a work order prematurely orphans WIP costs.
Developing Role-Specific Training Modules
Isolate training to necessary functions.
- Floor Operators: Focus strictly on scanning RM into production, logging machine time, and registering scrap.
- Warehouse Staff: Train heavily on cycle count entry, bin transfers, and receiving protocols to ensure accurate three-way matching in AP.
4: Going Live and Reaching the Final Result
The transition requires a hard financial cut-off and daily monitoring over variance accounts.
Running a Pilot Program (Soft Launch)
Execute a pilot on a single, isolated product line.
- Shortcut for Accountants: Run a “shadow” month-end close on the pilot line in both systems. Compare the cost of goods manufactured (COGM) and variance outputs. If the new system’s labor variance is materially different, investigate the routing times applied in the new system versus reality.
The Full System Rollout
Upon facility-wide cutover, deploy IT and Super Users to the floor. Require daily cycle counts of key A-class components for the first two weeks to catch and correct transactional errors immediately, such as issuing inventory to the wrong work order.
The Final Result: Ongoing Improvement
After implementation, managers must review and act on the data. The first financial return is usually visible in the close: a move from 15 days to 5 as automated GL postings replace manual journal entries. Cycle counting replaces annual physical stocktakes, preventing operation shutdowns. Managers can review variance as it occurs instead of waiting for month-end reports.
Realistic Scenario: Discrete Manufacturing (Woodfires & Aluminum Casting)
Context: A discrete manufacturer producing woodfires with an in-house aluminum casting facility. Turnover: $38M p.a. 85 employees.
The Problem: The company relied on manual production logs. WIP valuation was an estimate. Management was shocked by a $280,000 inventory write-down at year-end because actual cast scrap rates, mainly porosity defects, were 14%, while standard costs assumed 4%.
Implementation Strategy: We implemented an integrated ERP. We enforced barcode scanning at the casting mold break-out station.
The Financial Result: Scrap was recorded in real-time, instantly hitting the scrap expense GL rather than hiding in WIP. We updated the standard cost BOM to reflect an 8% expected yield loss, correctly pricing the product to maintain a 35% gross margin. Labor efficiency reporting allowed the plant manager to identify that the fettling (grinding) bottleneck was costing $45,000 annually in unabsorbed overhead due to downtime on the main assembly line. CapEx was approved for a second fettling station, clearing the bottleneck and increasing throughput by $1.2M annually.