
Total Manufacturing Cost Formula: Calculate & Reduce Costs
Total Manufacturing Cost (TMC) Analysis and Cost Reduction The Total Manufacturing Cost Formula is the method used to calculate the TMC core metric for standard costing and BOM rollups, and it underpins absorption costing. An accurate TMC calculation supports balance-sheet inventory valuation and P&L margin analysis. It also informs decisions about staffing, sourcing, pricing, and…
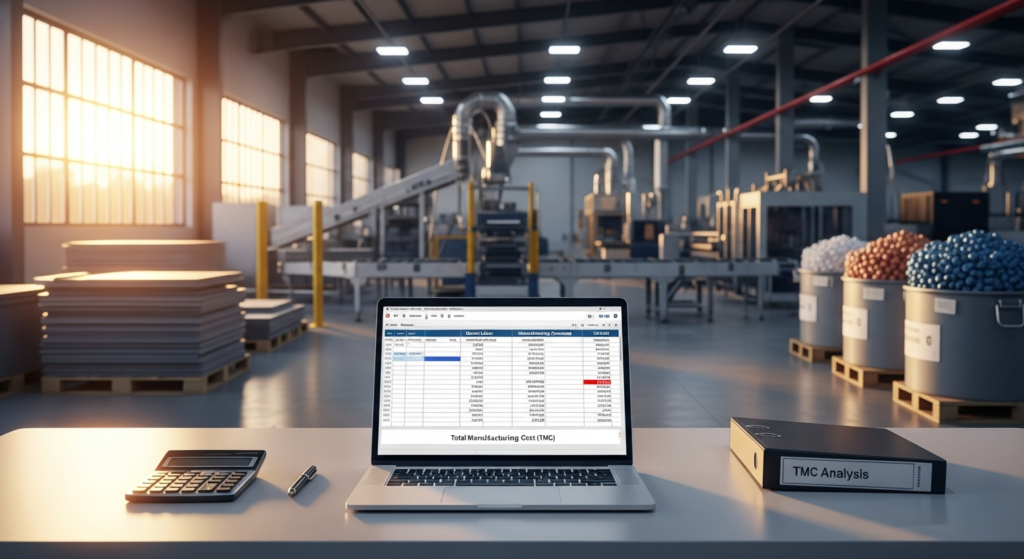
Total Manufacturing Cost (TMC) Analysis and Cost Reduction
The Total Manufacturing Cost Formula is the method used to calculate the TMC core metric for standard costing and BOM rollups, and it underpins absorption costing. An accurate TMC calculation supports balance-sheet inventory valuation and P&L margin analysis. It also informs decisions about staffing, sourcing, pricing, and plant consolidation. TMC shows whether higher volume is improving or hurting margins. In addition, it supports plant keep/close/consolidate decisions and can help move the month-end close toward a 5-day cycle.
The following controller-level framework covers how to record, calculate, and reduce manufacturing costs in discrete manufacturing.
What You Need: Essential Data and Tools
Producing an accurate TMC calculation requires stringent internal controls over factory floor data and accounting software.
Direct Materials (DM) Inventory Records
Relying on periodic inventory is insufficient for mid-market manufacturing. You require perpetual inventory records subject to rigorous cycle-counting controls.
- Data Inputs: Beginning inventory, precise cutoff for raw material purchases, including Goods Received Not Invoiced [GRNI] accruals, and ending inventory.
- Valuation Methodology: Define your inventory costing method, such as FIFO, Standard Costing, or Moving Average, within the ERP to isolate Purchase Price Variances (PPV).
Direct Labor (DL) Payroll Data
Labor must be captured at the routing level.
- Data Inputs: Time-and-attendance system data integrated with ERP shop-floor control modules.
- Cost Components: Gross wages of assembly staff, fabricators, and machine operators, fully burdened with payroll taxes, workers’ compensation, and fringe benefits. Exclude idle time or indirect tasks. Those costs belong in overhead.
Manufacturing Overhead (MOH) Expenses
MOH requires strict definitions of departmental cost pools.
- Data Inputs: General ledger accounts for factory rent, industrial utilities, equipment depreciation, maintenance, and indirect labor, including supervisors, QA, and material handlers.
- Allocation Base: Determine the appropriate driver for absorption costing, such as direct labor hours, machine hours, or units produced.
Calculation Steps: From Source Data to TMC
Step 1: Calculate Direct Materials Used
Calculate the raw materials physically consumed by the production order, adjusting for scrap and yield loss.
- Formula: Beginning Raw Materials + Purchases, with freight-in included, – Ending Raw Materials = Direct Materials Used.
- Audit Control: Reconcile physical stock against ERP quantities to identify shrinkage or unrecorded scrap variances.
Step 2: Calculate Direct Labor Costs
Aggregate fully burdened labor costs applied directly to production.
- Standard vs. Actual: Multiply actual hours worked by the actual fully burdened rate. Compare this against standard routing times to extract Labor Rate and Labor Efficiency Variances.
Step 3: Determine Manufacturing Overhead
Accumulate fixed and variable overhead cost pools, then apply them to production.
- Variable Overhead: Fluctuates with volume, such as machinery electricity and consumables like welding wire.
- Fixed Overhead: Remains constant regardless of volume, such as straight-line depreciation of CNC machines or the factory lease.
Step 4: Calculate TMC
Calculate the aggregate cost incurred during the financial period.
- Total Manufacturing Cost = Direct Materials Used + Direct Labor + Manufacturing Overhead
Realistic Scenario: Discrete Manufacturer: Lawnmowers
Context: A $40M turnover lawnmower and woodfire manufacturer. As the CFO, I reviewed the Q3 production run for our flagship commercial mower to establish a baseline for pricing updates and a cash flow forecast model.
Q3 Operational Data Matrix:
| Cost Category | Financial Data / GL Account | Amount (USD) |
|---|---|---|
| Direct Materials | Beginning Raw Materials (Q3) | $2,100,000 |
| + Purchases, including import duties and freight | $4,500,000 | |
| – Ending Raw Materials (Q3) | $1,800,000 | |
| Calculated DM Used | $4,800,000 | |
| Direct Labor | Assembly & Fabrication Wages | $950,000 |
| Payroll Taxes & Benefits (Burden) | $285,000 | |
| Calculated DL Incurred | $1,235,000 | |
| MOH | Factory Lease & Utilities | $310,000 |
| Indirect Labor (QA, Supervision) | $220,000 | |
| Machinery Depreciation | $150,000 | |
| Indirect Materials (Lubricants, tooling) | $85,000 | |
| Calculated MOH Incurred | $765,000 |
TMC Calculation:
$4,800,000 (DM) + $1,235,000 (DL) + $765,000 (MOH) = $6,800,000 Total Manufacturing Cost for Q3.
Management Action: The analysis identified a $120,000 unfavorable Material Usage Variance caused by lower yield from a new steel supplier. We switched back to the original supplier and preserved Q4 margins.
Cost Reduction Measures
Turning around a loss-making $4M manufacturer, or consolidating $60M international sites, requires disciplined TMC reduction tied to the cost build rather than broad cost cutting.
Improving Supply Chain and FX Management
- International Sourcing & Terms: Shift from domestic wholesalers to direct international component manufacturers. Negotiate payment terms from Net 30 to Net 90 to free up working capital.
- FX Hedging: If sourcing internationally, use forward contracts or options to lock in purchase prices and stabilize the Material Cost component of your BOM against currency volatility.
- Tax Credits: Audit R&D and export activities. In a past mandate, reclassifying specific tooling and prototyping workflows yielded a $750K tax credit, reducing net overhead.
Implementing Lean Manufacturing and Automation
- Facility Consolidation: Consolidate redundant manufacturing sites. Consolidating two international sites into one reduced fixed overhead, including duplicate rent and duplicate plant management, by more than $1.4M annually.
- ERP/WMS Upgrades: Implement barcoding and automated warehousing software. This reduces indirect labor in materials handling and eliminates costly cycle count discrepancies.
Common Mistakes to Avoid
Misclassifying Indirect and Direct Costs
Classifying QA inspectors or forklift drivers as Direct Labor inflates the DL base. When calculating standard labor rates, this misclassification distorts BOM rollups and can overstate product costs. Only touch-labor goes into DL; the rest is MOH.
Ignoring Equipment Depreciation
Failing to capture equipment depreciation under-absorbs fixed overhead. This makes gross margins appear artificially high. It can also understate the cash needed for future CapEx.
Cutoff Errors in Beginning and Ending Inventories
Relying on total purchases rather than materials used destroys the matching principle. Failing to account for GRNI, where inventory has been received on the dock but the supplier invoice has not yet been processed, will distort month-end TMC and put the 5-day close at risk.
Frequently Asked Questions (FAQ)
What is the exact Total Manufacturing Cost Formula?
Total Manufacturing Cost = Direct Materials Used + Direct Labor Incurred + Manufacturing Overhead Applied.
What is the difference between Total Manufacturing Cost (TMC), Cost of Goods Manufactured (COGM), and Cost of Goods Sold (COGS)?
- TMC: Total costs incurred on the factory floor during a specific period.
- COGM: TMC adjusted for the change in Work-in-Progress (WIP) inventory. TMC + Beginning WIP – Ending WIP = COGM.
- COGS: COGM adjusted for the change in Finished Goods inventory. This is the figure that hits the P&L as an expense against revenue.
How often should a manufacturing business calculate this metric?
Continuously, via standard costing within an ERP, with variance settlements finalized during a rigid 5-day month-end close. Quarterly analysis is too slow for modern supply chains. Material price fluctuations or labor inefficiencies can erode cash reserves before management adjusts customer contract terms or pricing.