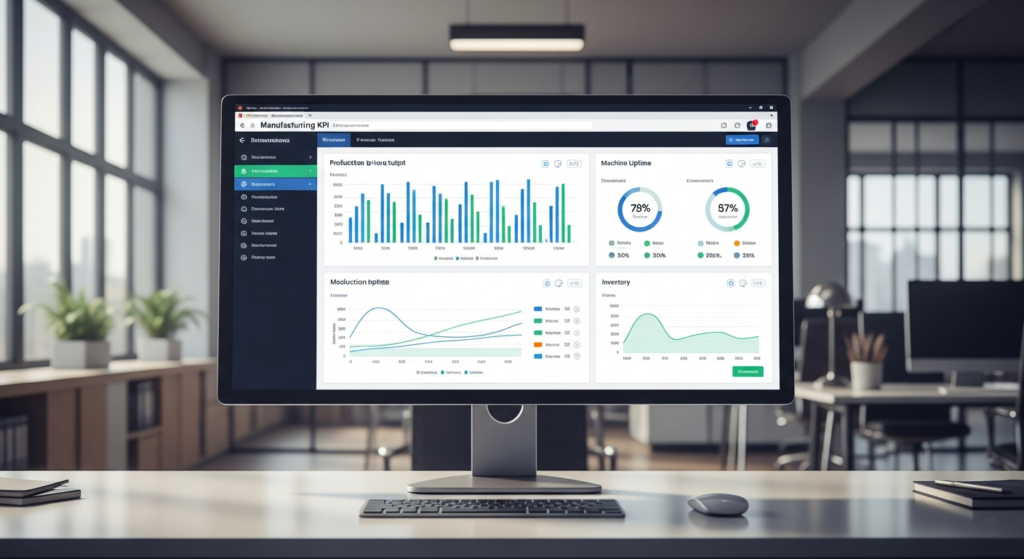
Best Manufacturing KPI Dashboard Software (2026 Review)
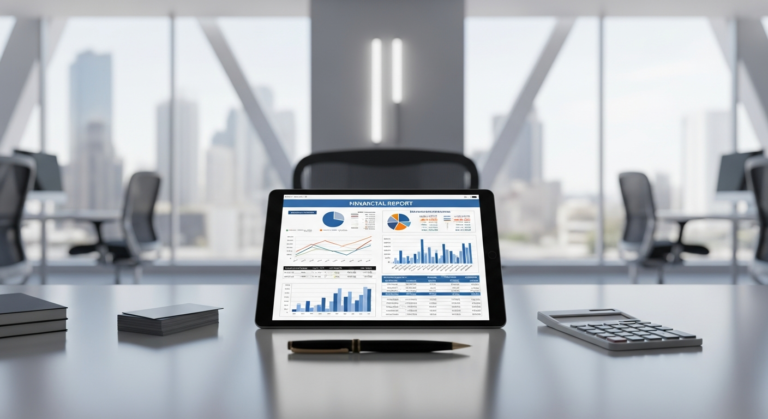
Manufacturing KPI Dashboard Software for Actionable Profit-Driving Insights Driving Profitability Through Data Manufacturing KPI dashboard software is a centralized digital tool that integrates with your ERP, accounting software, and shop-floor data to display real-time financial and operational metrics. In a hyper-competitive industrial landscape, having this immediate visibility is no longer a luxury—it is a baseline…
Manufacturing KPI Dashboard Software for Actionable Profit-Driving Insights
Driving Profitability Through Data
Manufacturing KPI dashboard software is a centralized digital tool that integrates with your ERP, accounting software, and shop-floor data to display real-time financial and operational metrics. In a hyper-competitive industrial landscape, having this immediate visibility is no longer a luxury—it is a baseline requirement.
Unfortunately, modern manufacturers still lose thousands of dollars daily due to siloed data and invisible production bottlenecks. When plant managers and financial leaders operate in different systems, delayed financial reporting becomes the norm. You cannot fix a costly production flaw today if you only discover it in next month’s spreadsheet.
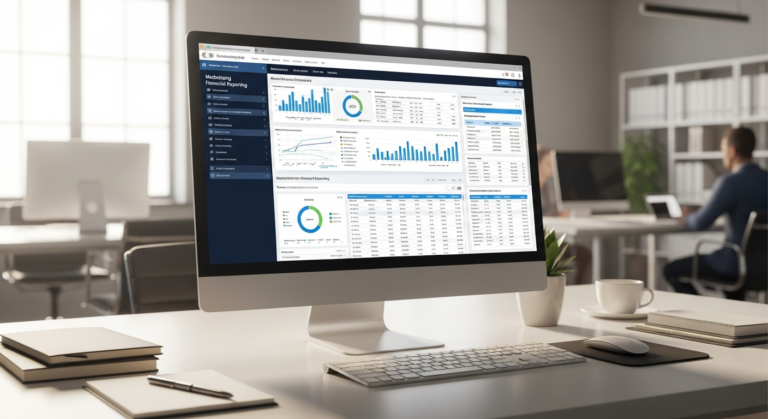
Investing in the right dashboard software bridges the crucial gap between the production floor and the CFO’s desk. It turns raw, disconnected data into actionable, profit-driving insights that empower your entire leadership team. Here is our objective breakdown of the top tools to help you make the smartest purchasing decision for your plant in 2026.
Top Manufacturing KPI Dashboard Software: In-Depth Reviews
1. Microsoft Power BI – Best for Enterprise Financial Reporting
Overview:
Microsoft Power BI is a powerhouse analytics platform designed to digest massive datasets and transform them into interactive visual reports. It acts as the ultimate connective tissue for large manufacturing plants running on complex Microsoft ecosystems.
Pros and Cons:
- Pros: Offers incredibly deep ERP integrations, highly customizable financial modeling, and robust real-time data alerts.
- Cons: Features a notoriously steep learning curve and almost always requires dedicated IT resources for initial setup and maintenance.
Value for Money:
Power BI provides exceptional value if you have the internal bandwidth to wield it properly. While the per-user licensing is reasonably priced, the true financial ROI comes from its unparalleled waste reduction and efficiency tracking at a global scale. It effectively centralizes millions of data points into a single source of truth.
Who This Is For:
This platform is ideal for large-scale manufacturers with complex, multi-site financial reporting needs. If you have a dedicated data team and run your operations on Dynamics 365 or massive SQL databases, Power BI is your ultimate solution.
2. Databox – Best for Fast Implementation & Usability
Overview:
Databox is a highly agile, plug-and-play dashboarding tool built for speed and accessibility. It allows operations teams to pull metrics from dozens of standard software platforms into clean, understandable dashboards without writing a single line of code.
Pros and Cons:
- Pros: Features pre-built manufacturing templates, an incredibly intuitive drag-and-drop interface, and a highly accessible mobile app for on-the-go tracking.
- Cons: Has limited deep-dive data transformation capabilities, making it less suitable for highly complex, multi-layered financial reporting.
Value for Money:
Databox utilizes a highly transparent subscription model that scales predictably as your company grows. It typically pays for itself within the first month simply by saving your team hours of manual Excel reporting. The rapid time-to-value is its strongest financial selling point.
Who This Is For:
This software is perfect for small to mid-sized manufacturing plants looking for immediate visibility. It is the go-to choice for operations directors who want clear, real-time metrics without waiting on a heavy IT investment or lengthy implementation cycle.
3. Tableau – Best for Predictive Maintenance & Cost Forecasting
Overview:
Tableau is an industry-leading visual analytics engine known for its ability to handle complex data visualizations. For manufacturers, recent advancements in AI and machine learning have made AI a top-tier tool for predictive analytics and advanced forecasting.
Pros and Cons:
- Pros: Delivers superior data visualization, predictive cost-overrun modeling, and excellent drill-down capabilities for granular analysis.
- Cons: Comes with expensive per-user licensing fees and requires significant processing power to run complex predictive models smoothly.
Value for Money:
Tableau is undeniably an expensive investment, but the financial justification is clear when applied to risk mitigation. The high upfront cost is quickly offset by its ability to prevent costly machine downtime and predict supply chain delays before they happen. It shifts your strategy from reactive to proactive.
Who This Is For:
Tableau is designed for forward-thinking plant operations directors and CFOs. If your goal is to transition from simple historical reporting to advanced predictive financial modeling, this is the premium tool to help you get there.
Buyer’s Guide: How to Choose the Right Manufacturing Dashboard
Evaluating Value for Money & True ROI
Calculating the true ROI of a dashboard goes far beyond looking at the monthly sticker price. You must account for the hidden costs of software, which include implementation fees, employee training, and ongoing technical maintenance. A “cheap” software solution that requires a costly external consultant to run is not a bargain.
When comparing subscription models, assess whether a per-user or flat-rate tier makes more sense for your plant’s size. Flat-rate plans are often better for fast-growing plants that want to give dashboard access to every shift supervisor without getting nickel-and-dimed.
Ultimately, the ROI is realized through time saved and errors prevented. Automated reporting eliminates administrative overhead, allowing your analysts to stop formatting spreadsheets and start hunting for cost-saving opportunities.
Essential Manufacturing Financial KPIs It Must Track
A dashboard is only as good as the metrics it monitors. Before signing a contract, ensure the software can natively calculate and display the following metrics:
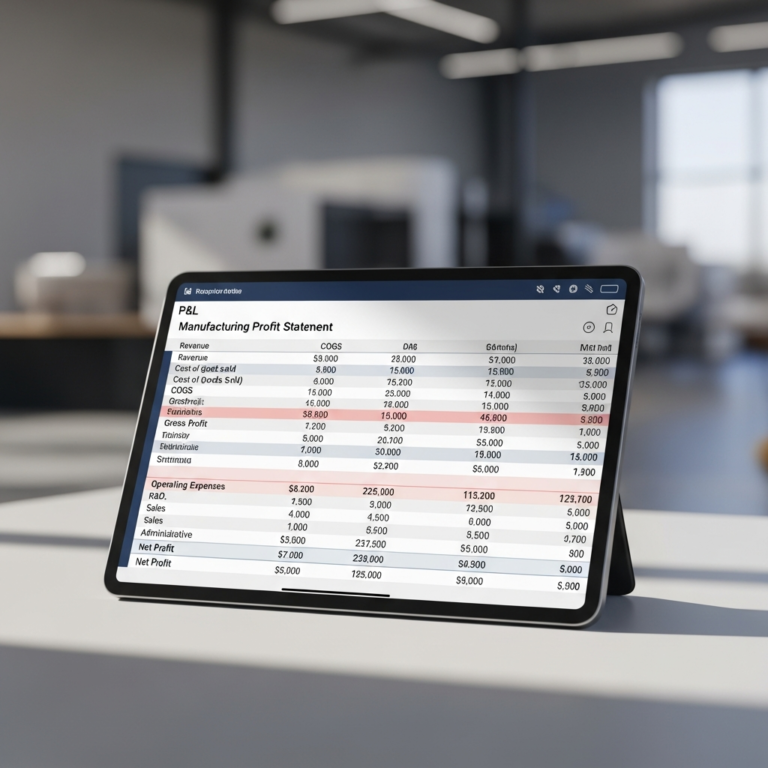
- Cost of Goods Sold (COGS): The direct costs attributable to the production of the goods sold by a company, including material and direct labor.
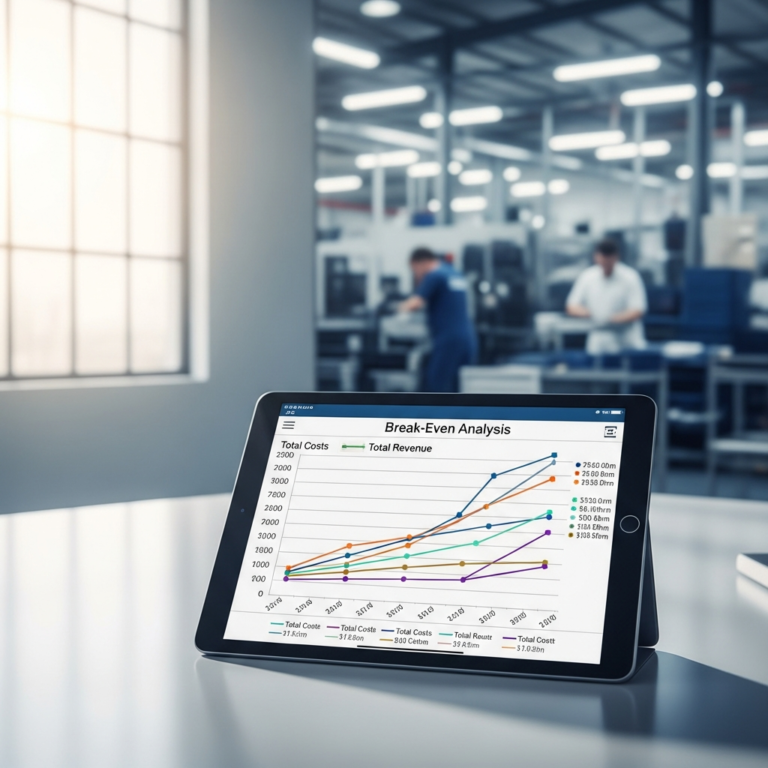
- Overall Equipment Effectiveness (OEE): A metric that multiplies availability, performance, and quality to determine the percentage of manufacturing time that is truly productive.
- Inventory Turnover: A ratio showing how many times a company has sold and replaced its inventory during a given period.
- Gross Profit Margin: A profitability ratio that calculates the percentage of revenue that remains after deducting the cost of goods sold.
Integration Capabilities (The Dealbreaker)
A beautiful dashboard is useless if it cannot speak to your existing systems. Integration capability is the absolute dealbreaker when choosing manufacturing software.
Your chosen software must provide seamless, reliable API connections to your current tech stack. Whether you use SAP, Oracle, QuickBooks, or Salesforce, the data pipeline needs to be automated and resilient to ensure your metrics remain highly accurate in real-time.
Who This Is For (And Who Should Wait)
CFOs & Financial Analysts in Manufacturing
Financial leaders desperately need these tools to eliminate manual spreadsheet consolidation. Relying on static data leaves your plant vulnerable to sudden market shifts and hidden production costs.
By utilizing real-time dashboards, CFOs can accurately forecast cash flow and monitor profit margin shifts, shift by shift. It elevates the finance team from historical scorekeepers to strategic business partners.
Plant Managers & Operations Directors
For operations teams, these dashboards serve as the heartbeat monitor of the factory floor. They provide the situational awareness needed to keep production running smoothly and safely.
Real-time dashboards allow operations directors to spot production line inefficiencies and machine downtime instantly. This enables rapid course correction before a minor hiccup impacts the monthly bottom line.
Who Should Hold Off?
Not every manufacturing operation is ready for an advanced KPI dashboard. Micro-manufacturers or custom job shops that still rely on paper records or basic ledgers should hold off on this investment.
If you have not yet digitized your basic accounting and inventory systems, a dashboard will have no data to display. Focus on implementing foundational software, like a basic cloud ERP or digital accounting tool, before investing in advanced analytics.
Frequently Asked Questions (FAQs) About Manufacturing Dashboards
What is the average cost of manufacturing KPI dashboard software?
The cost of this software varies wildly depending on your required scale and complexity. Entry-level, plug-and-play dashboards generally range from $100 to $500 per month for small teams.
Conversely, enterprise-grade solutions like Power BI or Tableau can cost tens of thousands of dollars annually. This enterprise pricing is dictated by the volume of data processed, the number of active users, and the necessity for custom API integrations.
Can these dashboards integrate with legacy or on-premise ERP systems?
Yes, but it requires a more strategic technical approach. While cloud-to-cloud connections are usually native, legacy systems require custom bridges.
Modern dashboard software achieves this through custom API connectors, SQL database integrations, and third-party data pipelines. You will likely need an internal IT specialist or an implementation partner to build and secure these custom data routes.
How long does it take to implement a financial reporting dashboard?
Timelines depend entirely on the specific tool you choose and the cleanliness of your existing data. Plug-and-play tools with pre-built templates can often be set up and used within 1 to 2 weeks.
Custom-built enterprise solutions are a different story entirely. A full-scale implementation spanning multiple factories and complex ERP systems realistically takes anywhere from three to six months to achieve full adoption.
The Final Verdict: Which Software Should You Buy?
Best Overall Value for Money
For most mid-sized manufacturers, balancing robust financial reporting with a reasonable price tag, Databox is our top recommendation. It delivers rapid time-to-value and eliminates manual reporting without requiring an IT overhaul. Start a free trial today to see your shop-floor data visualized in minutes.
Best for Complex Enterprise Operations
If you are managing massive supply chains and require deep, predictive financial analytics, Microsoft Power BI remains the undisputed king. It offers the sheer processing power and deep integration capabilities necessary for global operations. Contact the Microsoft enterprise sales team to request a tailored demo for your plant.
Best for Quick Operational Visibility
When you need immediate shop-floor visibility to track OEE and production bottlenecks today, Databox wins again for its unmatched speed of deployment. Its intuitive mobile app and drag-and-drop interface make it the ultimate fast-action tool. Sign up today to immediately connect your floor to your financial goals.